|
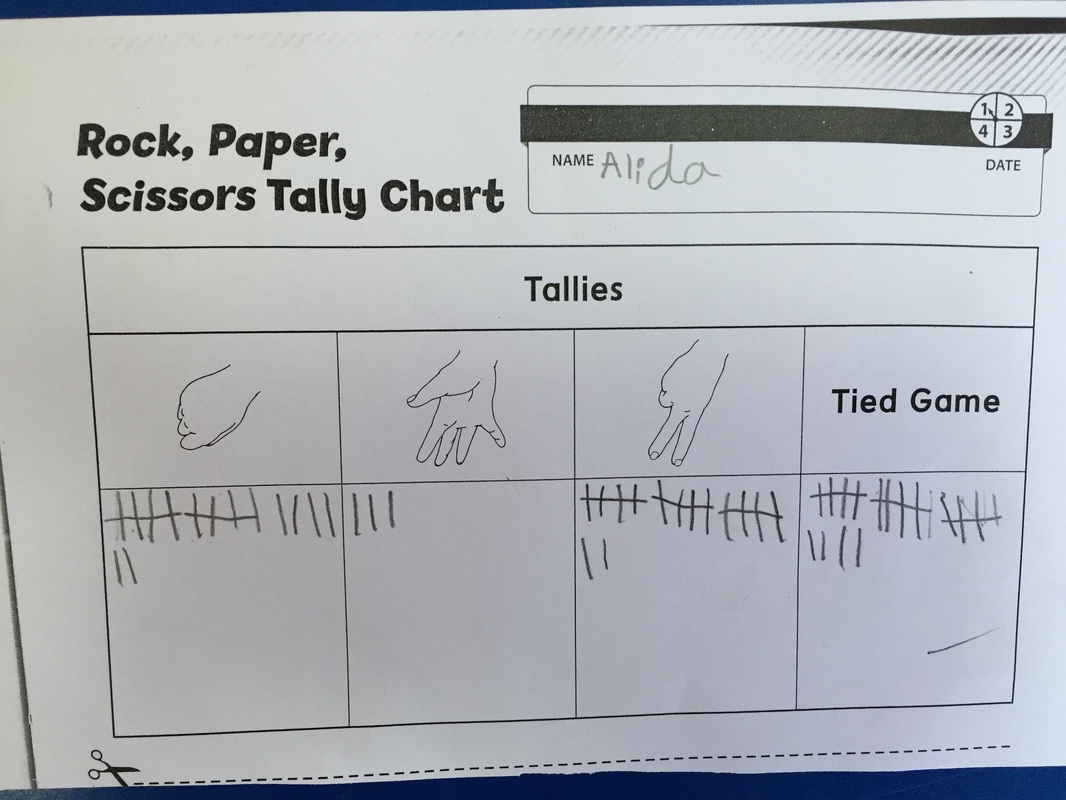
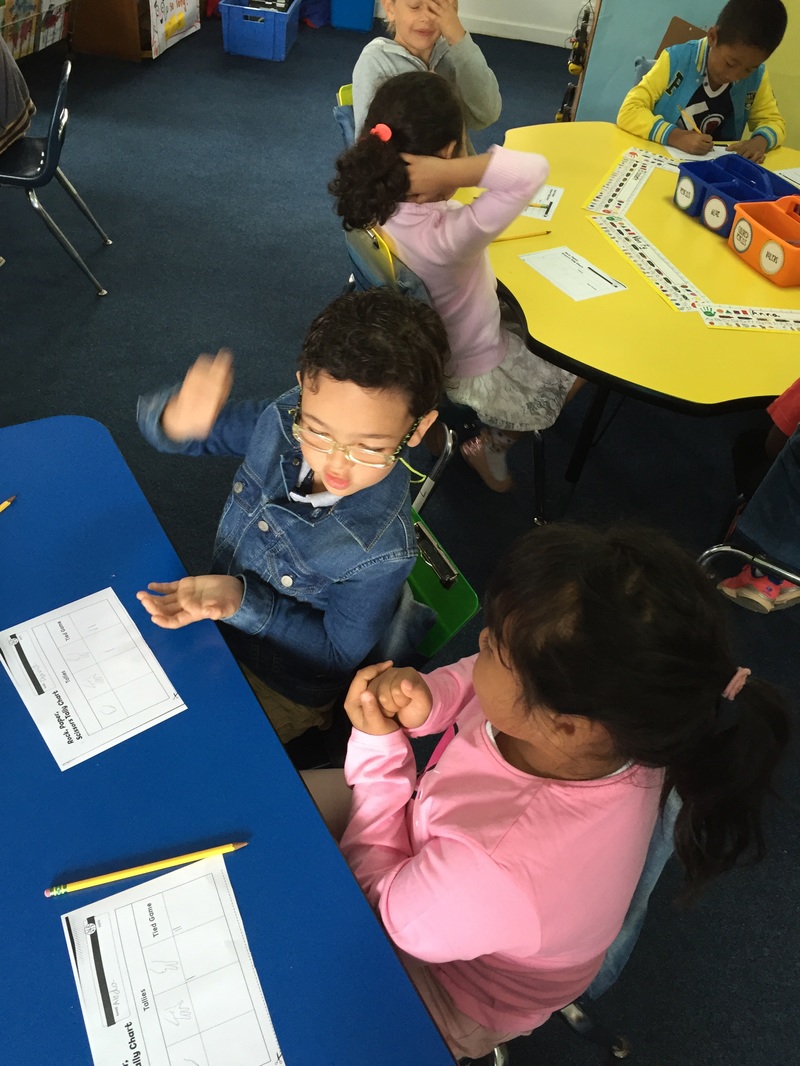
To further explore tallying as a data-collection strategy, students used tallies to record the results of a Rock, Paper, Scissors game. Students played for 5 minutes. After each round, they made a tally mark in the chart to indicate either the winning gesture or that the round ended in a tie. The students were encouraged to speculate about whether one gesture would win more often than the others. We discussed the chance of winning a game compared to the chance of tying. Using tally marks to record the results, students discovered that winning happens about twice as often as tying
0 Comments
Rainbow Fish shared his scales to make his friends feel special. Alida makes her friends feel special by sharing and saying "hi" to them 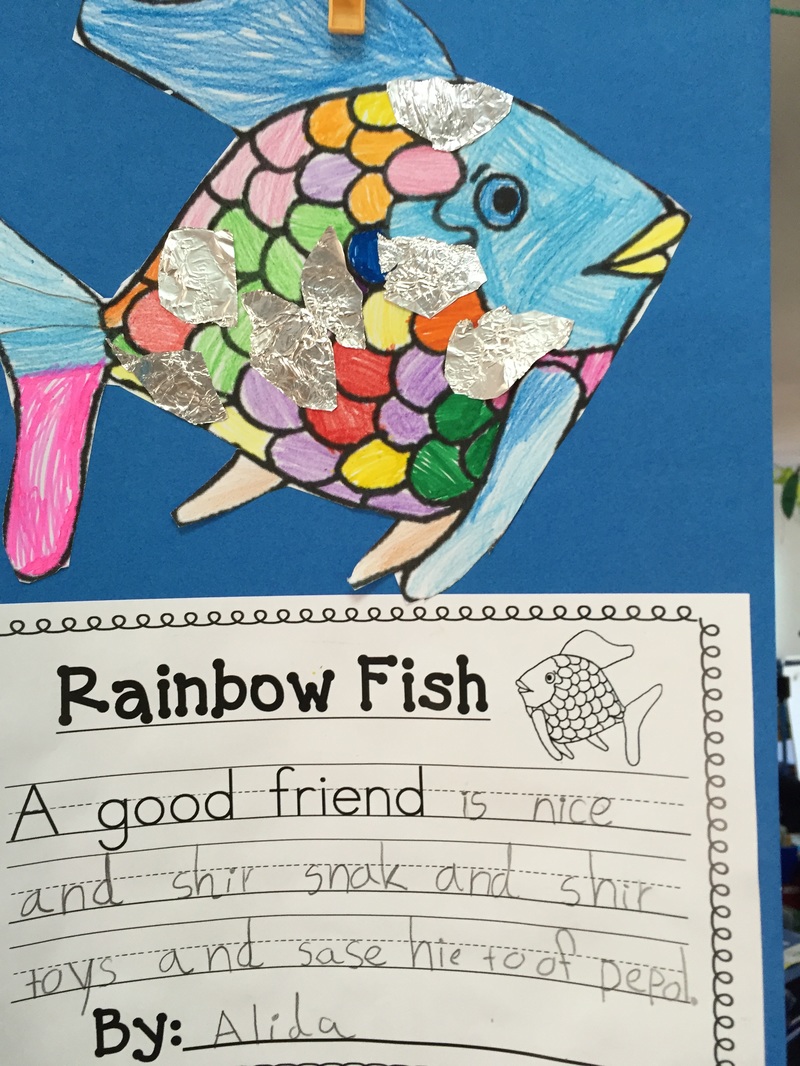 Today we learned about a new way to represent counting using tally marks. We discussed where we have seen tally marks before and how they are helpful for counting. Following this, we talked about organizing and representing categorical data. Using sorting cards, we sorted animal cards based on similarities and differences. We noticed that there were many ways we could sort and organize these cards. Alida decided on two categories and used the tally chart to represent the data from her sort. 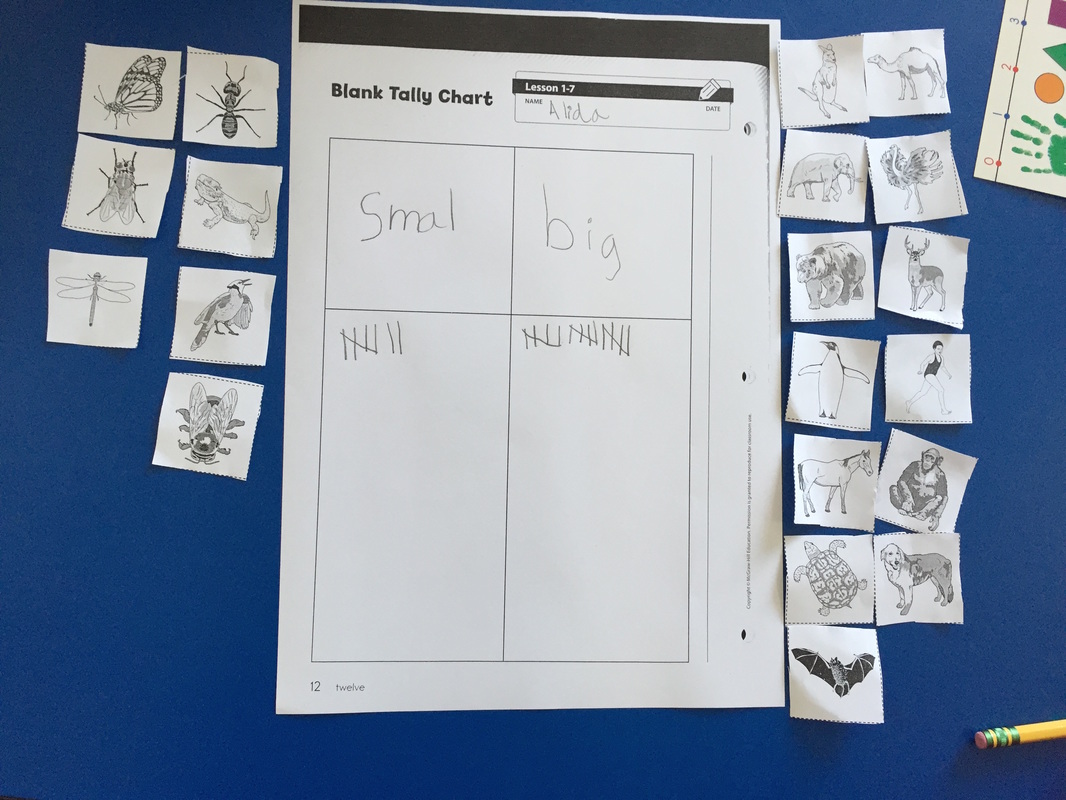 We read ‘The Crayon Box That Talked’. In this story, talking crayons learn to appreciate one another when the narrator draws with them, thus showing them how each helps create a bigger picture. The message of the book is to learn to appreciate rather than dislike other people's differences. We drew a picture of crayons cooperating, and crayons not cooperating to show how when we work together, everything is better. 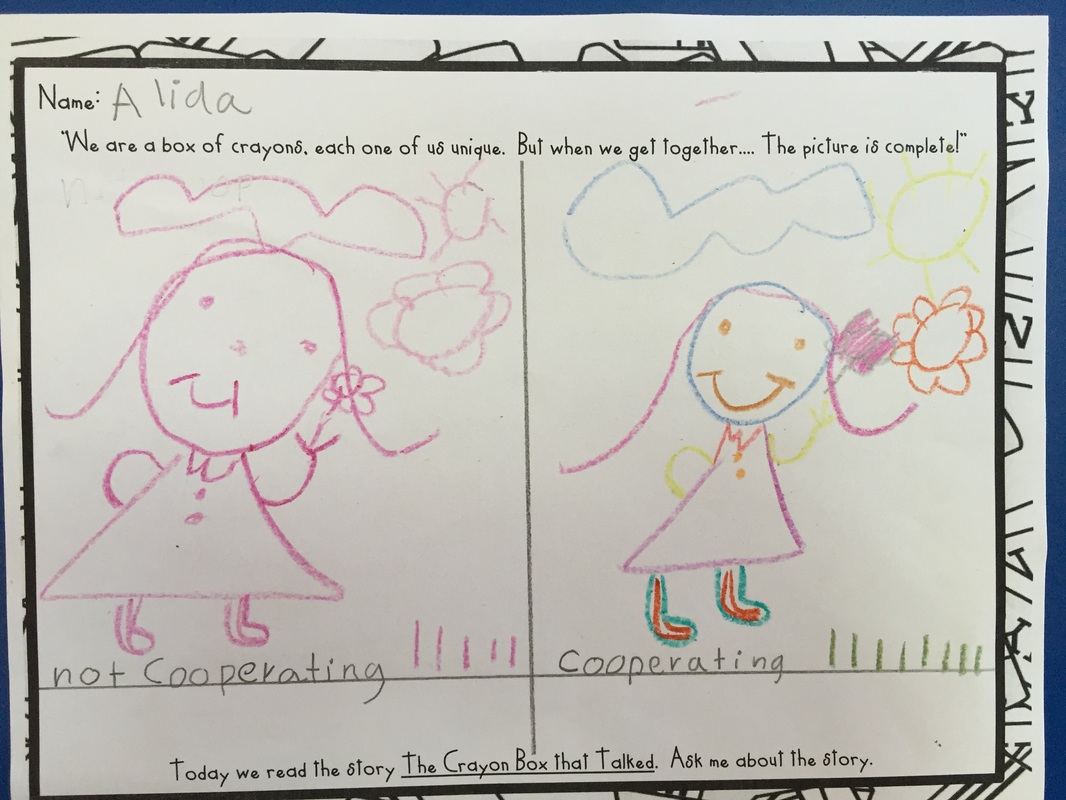 Alida watched this Pixar short and identified what she thought was the problem and solution 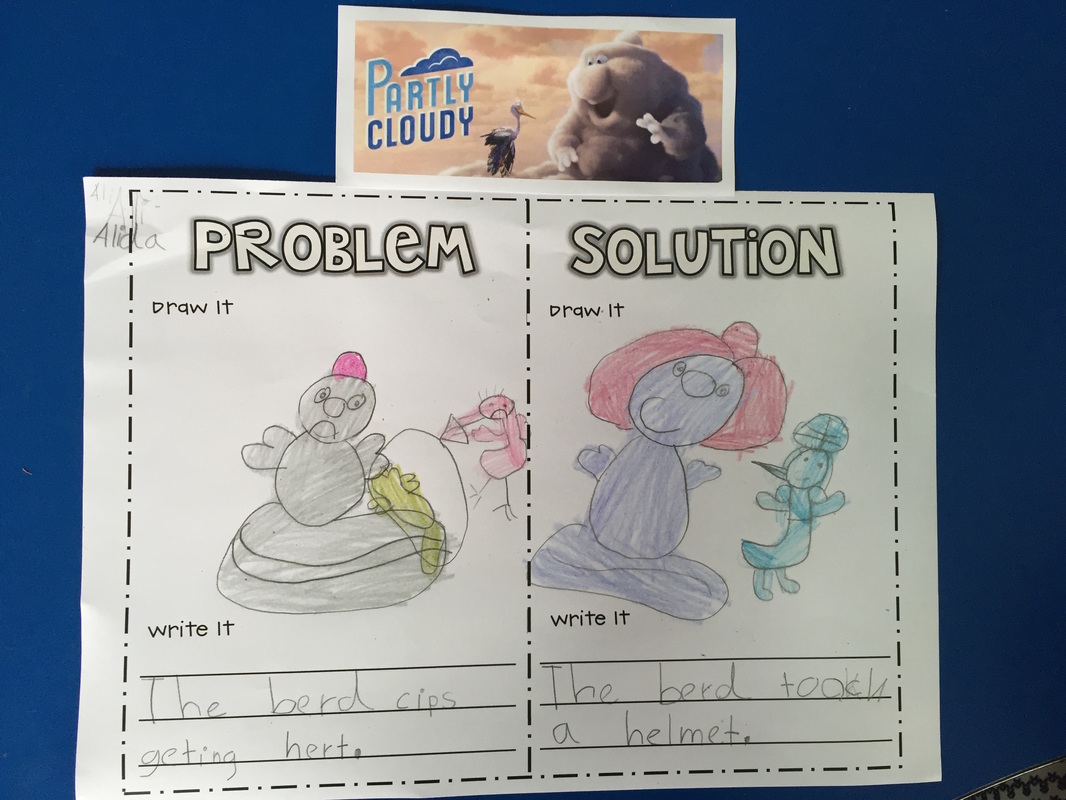 We read 'Ira Sleeps Over'. Alida drew and wrote the problem and solution in the story. 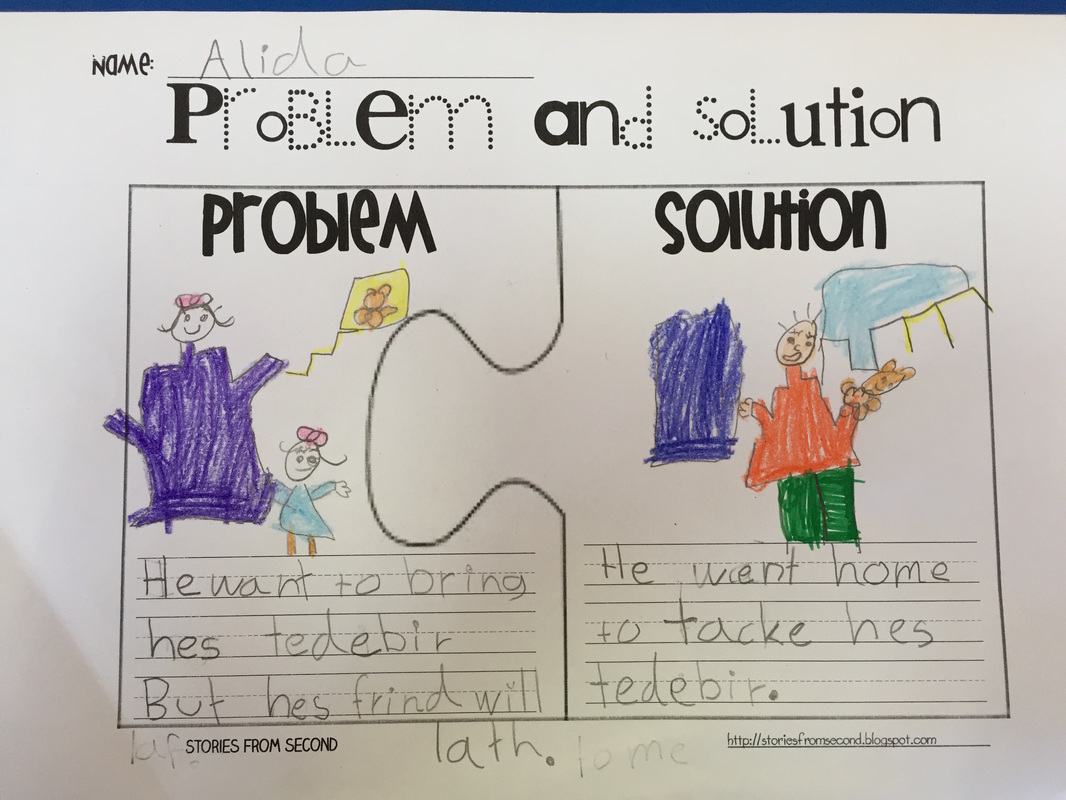 Today we read 'Franklin is Lost'. Alida used adjectives to describe the setting. 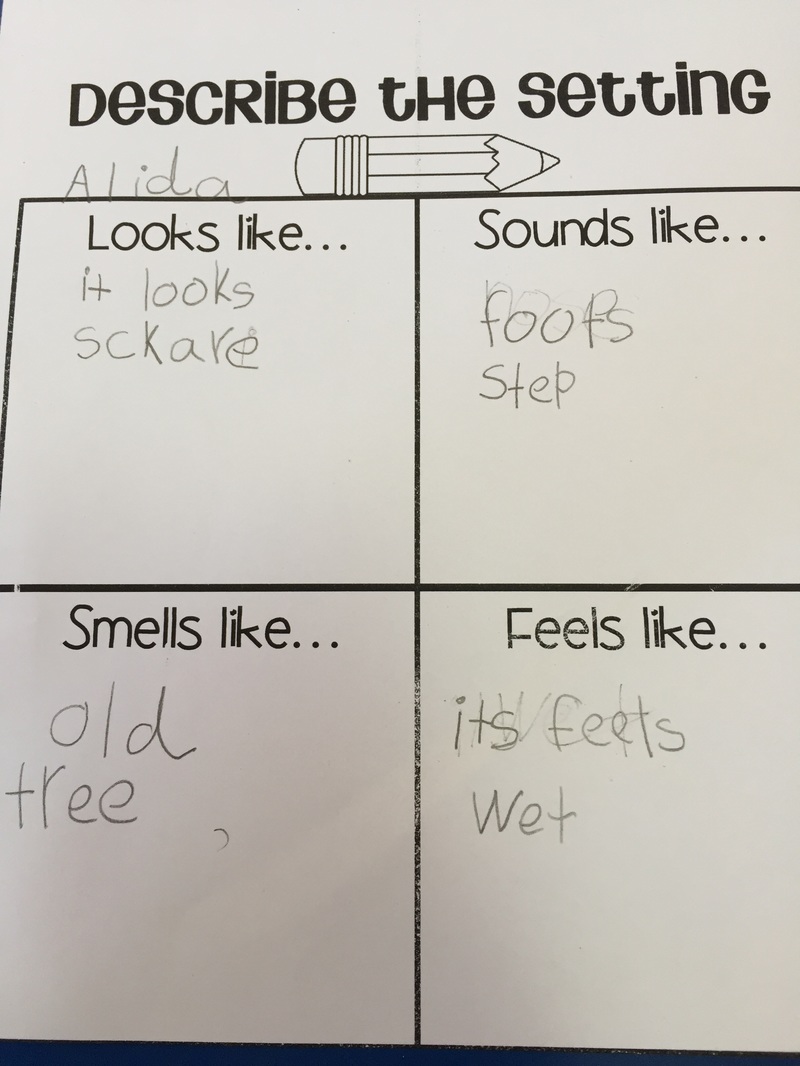 |
 RSS Feed
