|
To further explore tallying as a data-collection strategy, students used tallies to record the results of a Rock, Paper, Scissors game. Students played for 5 minutes. After each round, they made a tally mark in the chart to indicate either the winning gesture or that the round ended in a tie. The students were encouraged to speculate about whether one gesture would win more often than the others. We discussed the chance of winning a game compared to the chance of tying. Using tally marks to record the results, students discovered that winning happens about twice as often as tying. 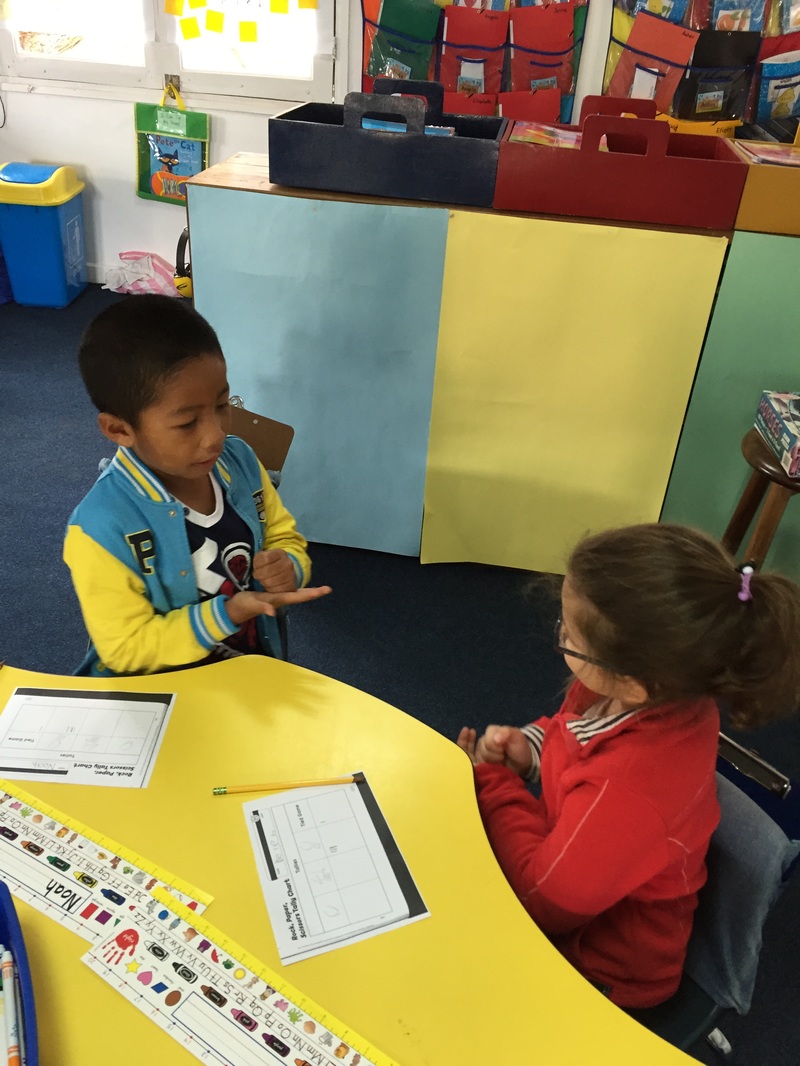 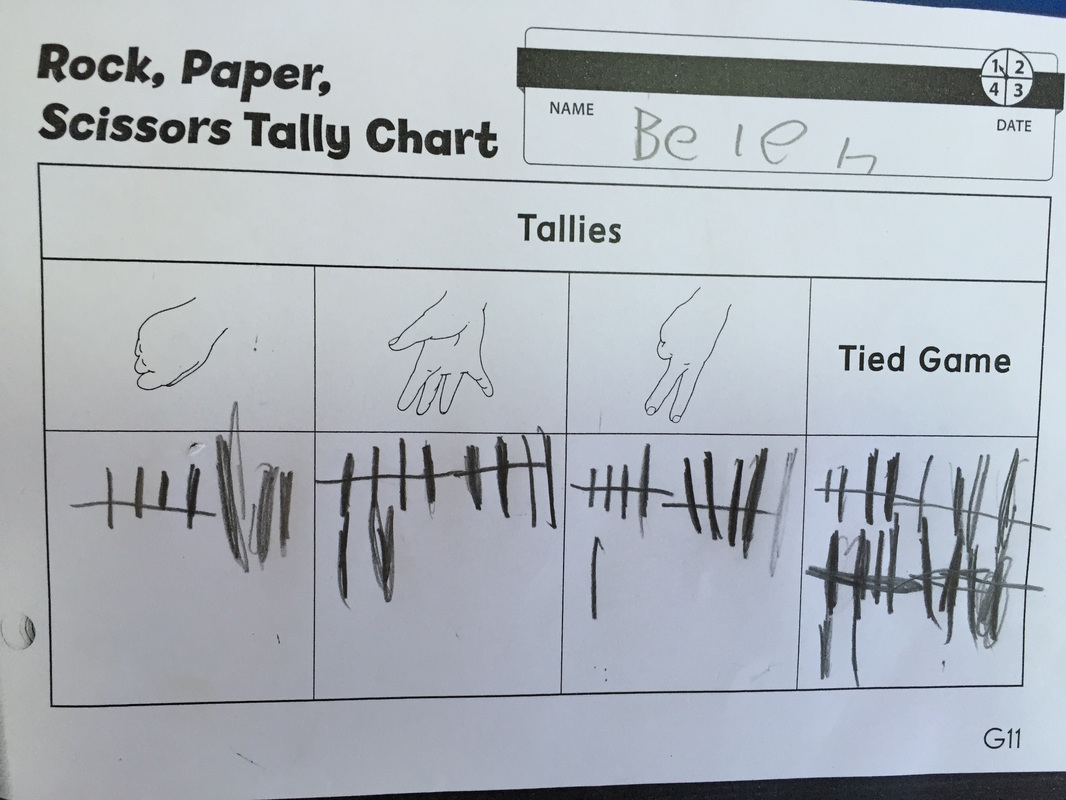
0 Comments
Today we learned about a new way to represent counting using tally marks. We discussed where we have seen tally marks before and how they are helpful for counting. Following this, we talked about organizing and representing categorical data. Using sorting cards, we sorted animal cards based on similarities and differences. We noticed that there were many ways we could sort and organize these cards. Your child decided on two categories and used the tally chart to represent the data from their sort. 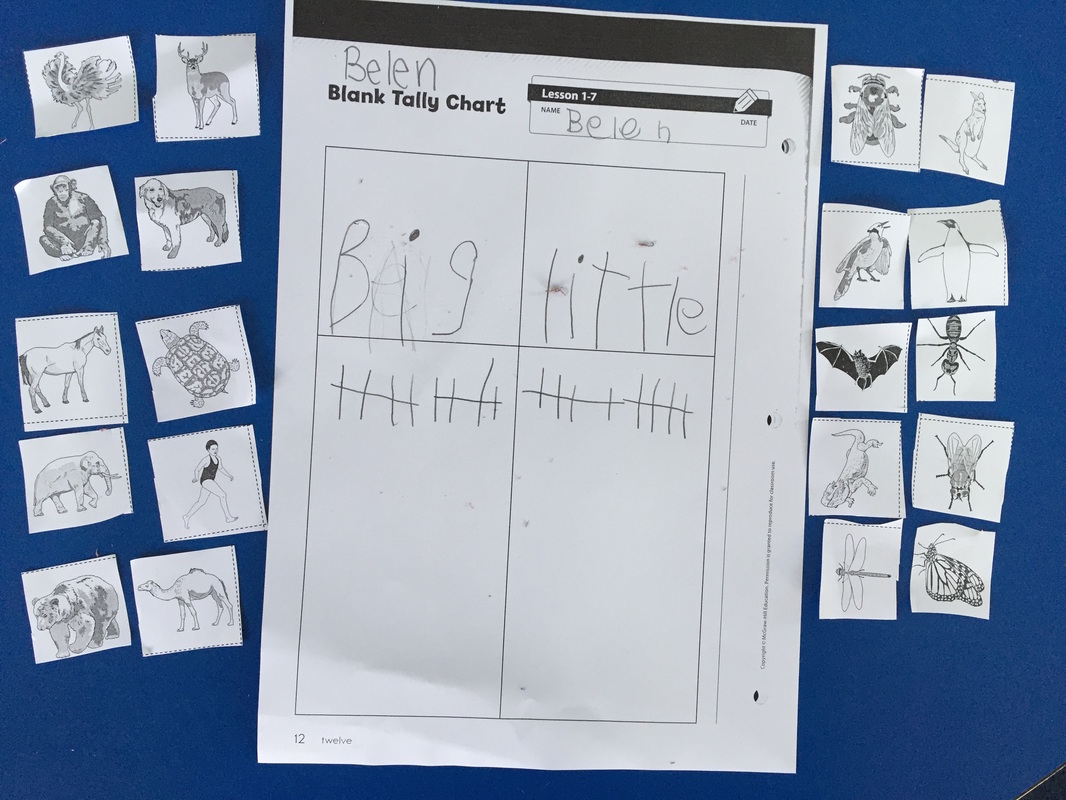 |
BelenArchives
March 2017
Categories
All
|
 RSS Feed
